1) HFIP Deterministic model products:
Graphics are generated for both the Regional Scale domain (also known as the parent domain) and when running a storm scale model is applicable, the Storm Scale domain (also known as the child domain). Display of the following variables for all deterministic models are available.
These graphics are created using the GrADS
visualization tool.
- Mean Sea Level Pressure (4 and 2 mb contours)
- 10 m wind
- 1000-850 mb thickness
- 850 mb wind
- 850 mb height
- 850 mb vorticity
- 700 mb relative humidity
- 700 mb wind
- 700 mb height
- 700 mb vorticity
- 500 mb height
- 500 mb wind
- 500 mb vorticity
- 200 mb wind
- 200 mb height
- A combined graphic with 850 vorticity, 500 height, 200 wind
The variables listed above are consolidated into six specific images for each scale in the following configuration:
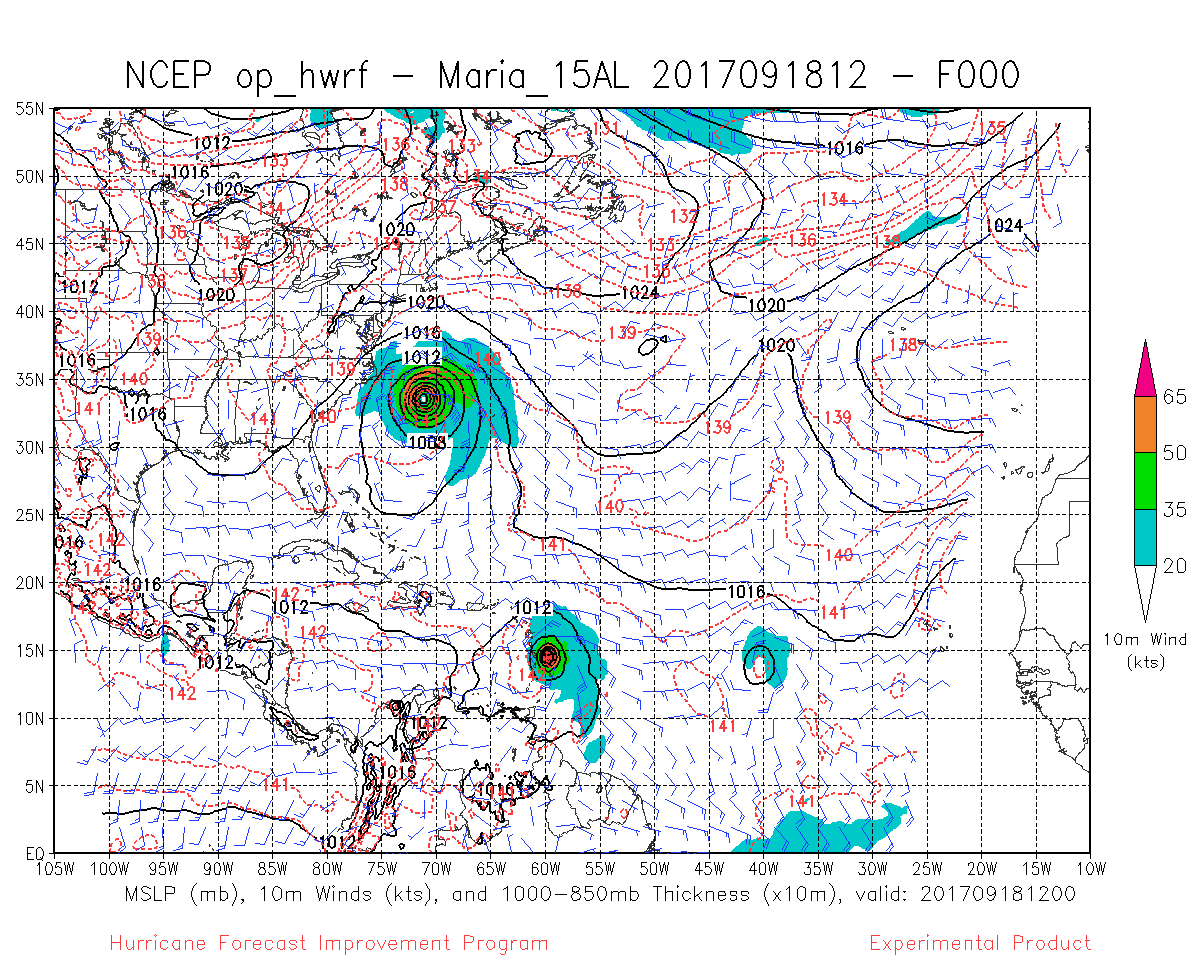
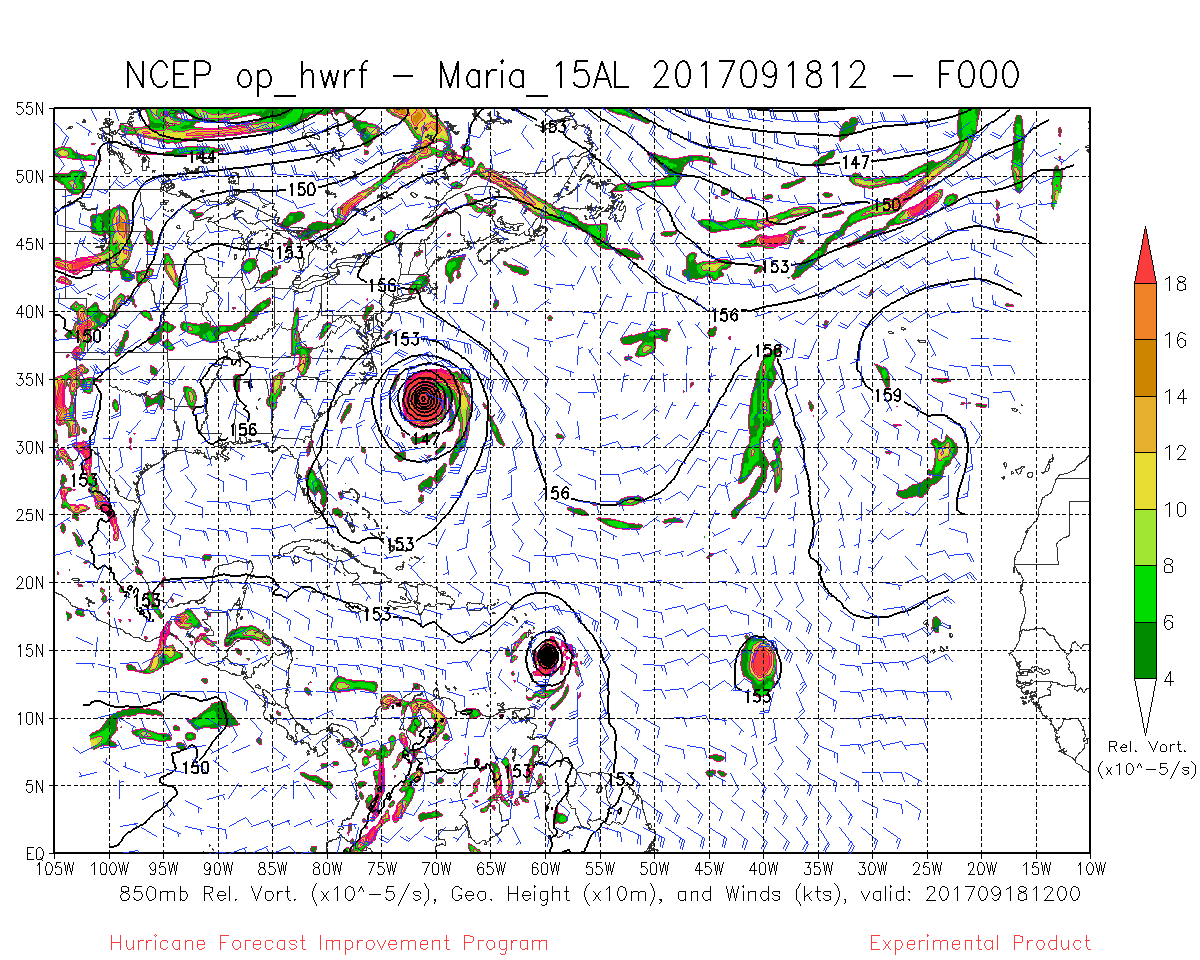
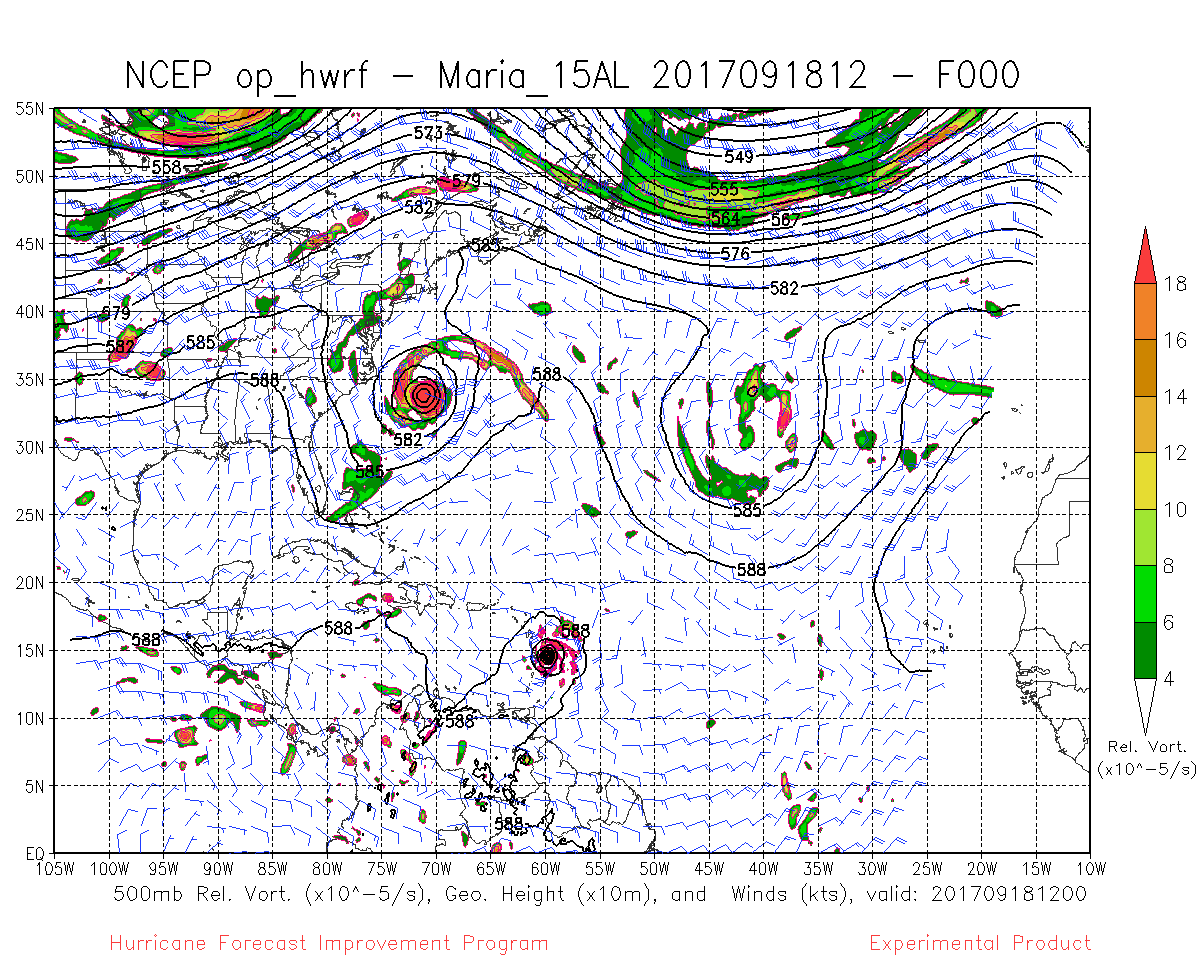
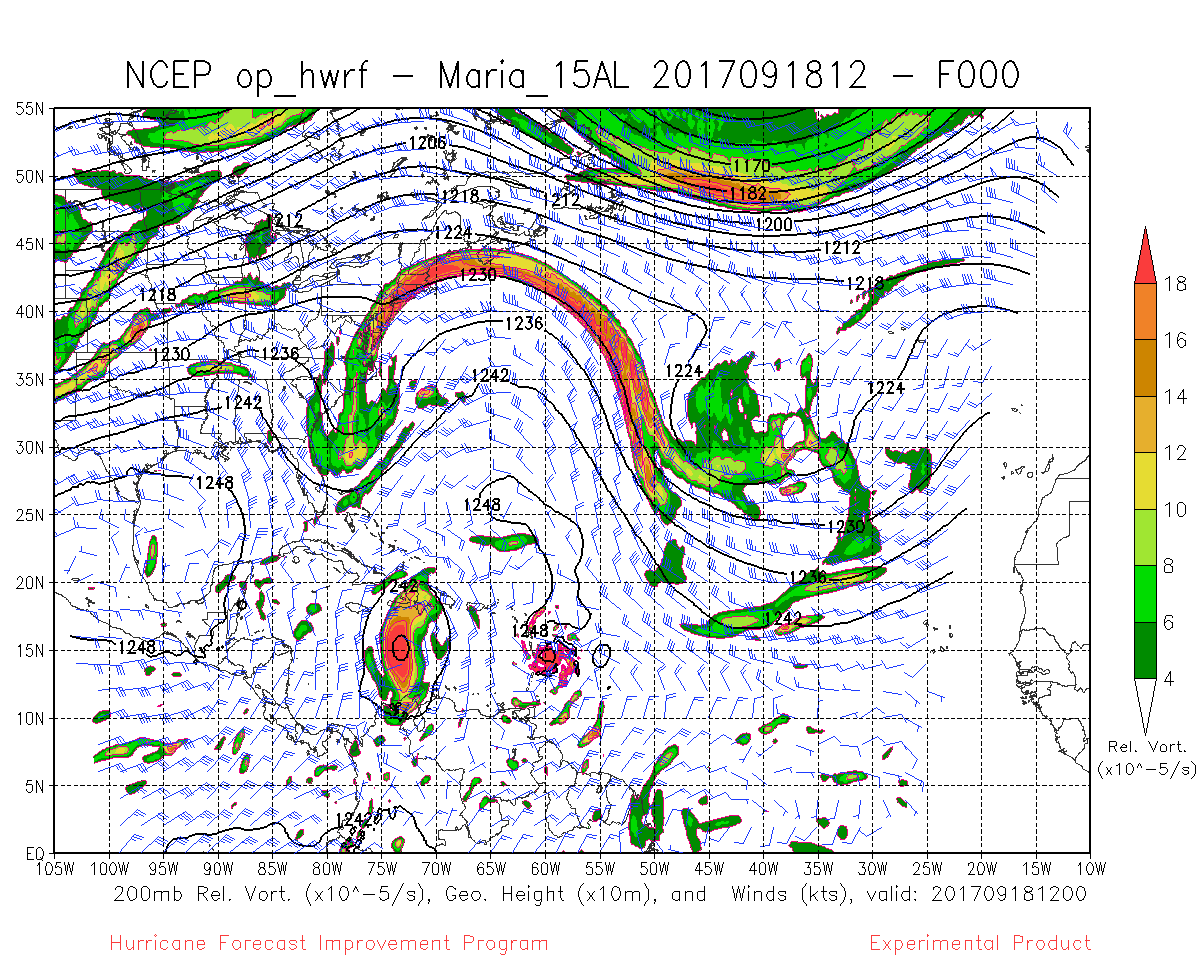
Regional Scale Graphics: (Sample graphics from TC Maria 15L, Sept 15, 2017 12Z, Operational HWRF run)
/d2/www/hfip/hfipprd/2017/determine/op_hwrf/2017093012/Maria_15AL
o
Sea Level Pressure (mb), 10m Wind (kts), and 1000-850mb Layer Thickness (x10m)
o
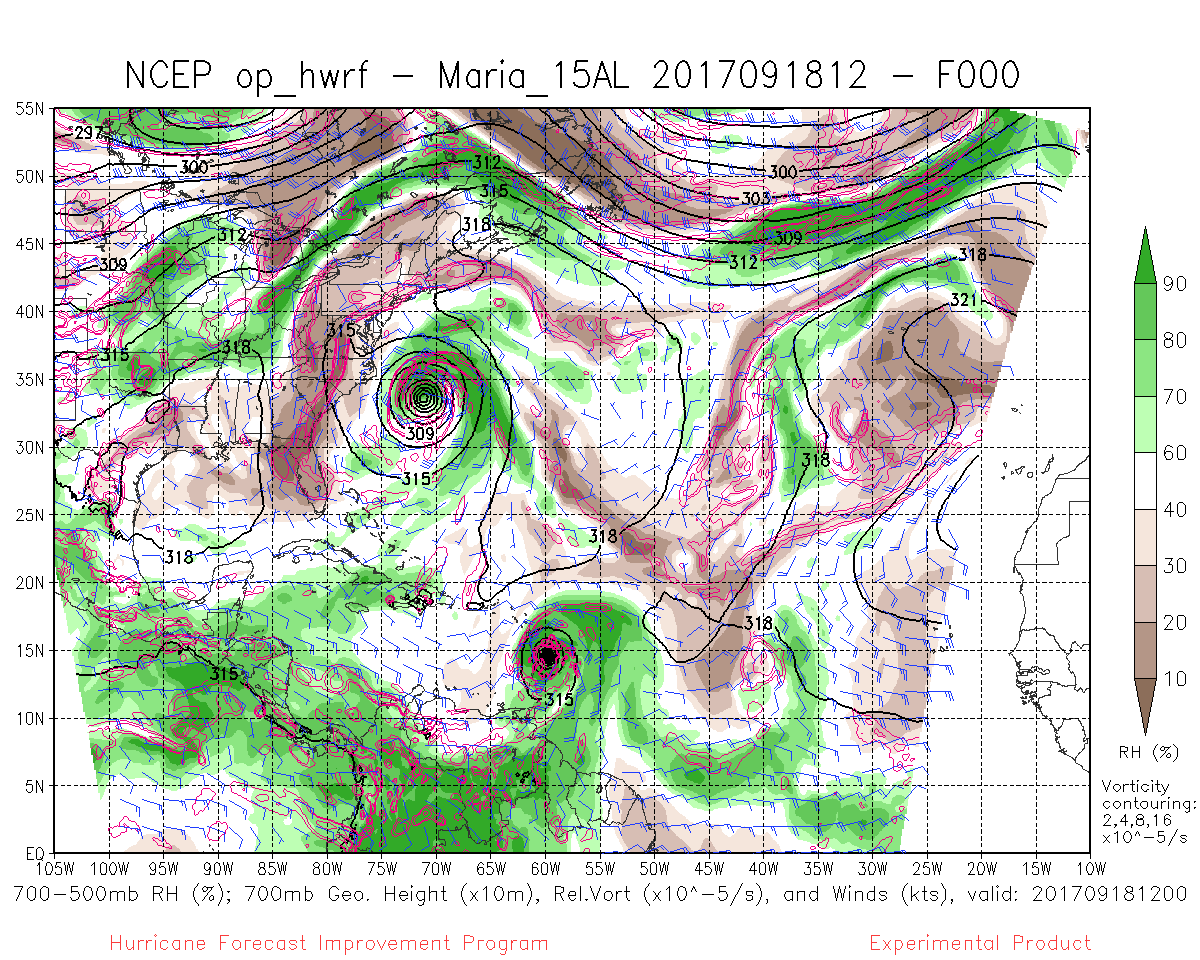
700mb Geopotential Height (x10m), 700mb Wind (kts), and 700-500mb layer averaged Relative Humidity (%)
o
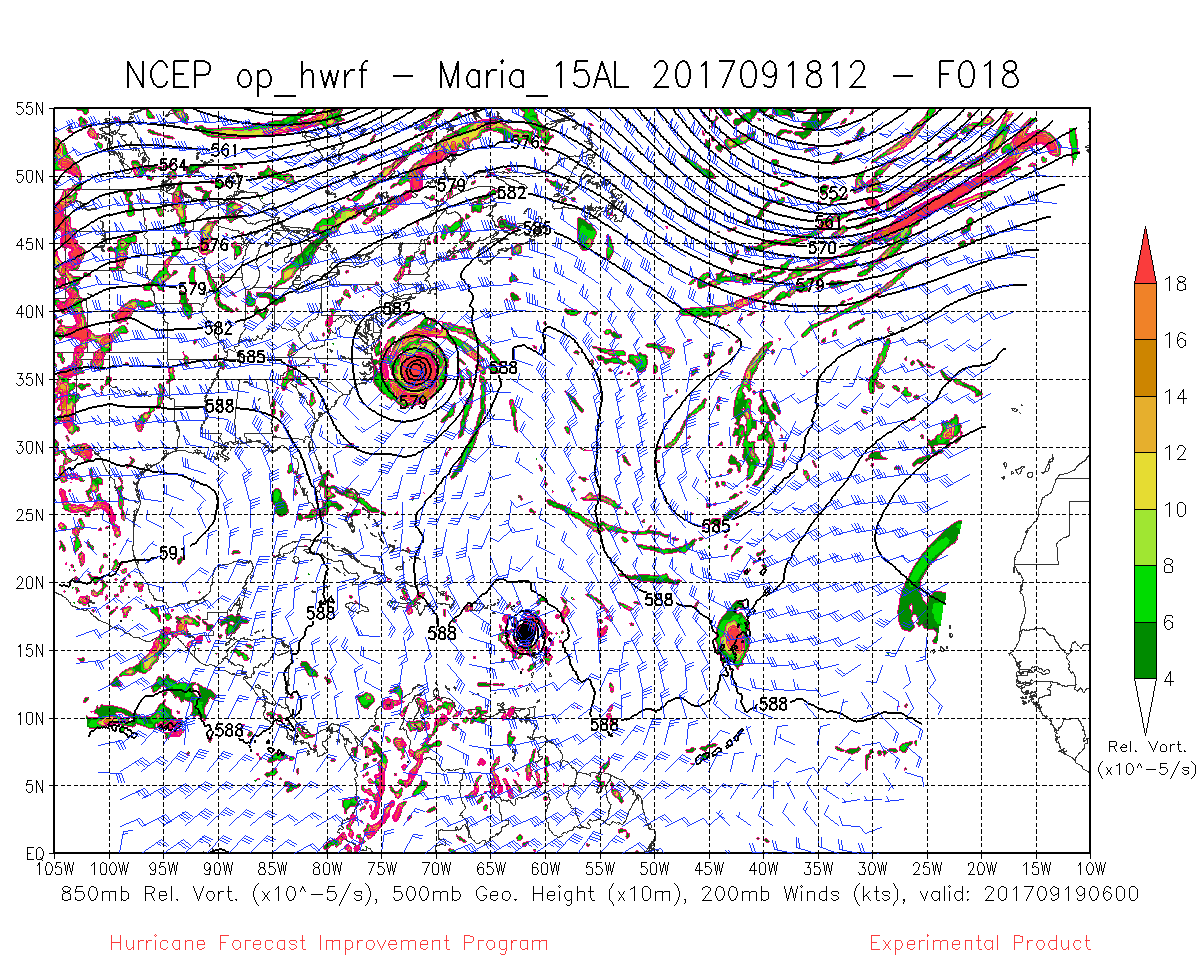
Combination of 850mb Relative Vorticity (x10-5 s-1), 500mb Geopotential Height (x10m), and 200mb Wind (kts)
o
850mb Relative Vorticity (x10-5 s-1), Geopotential Height (x10m), and Wind (kts)
o
500mb Relative Vorticity (x10-5 s-1), Geopotential Height (x10m), and Wind (kts)
o
200mb Relative Vorticity (x10-5 s-1), Geopotential Height (x10m), and Wind (kts)
o
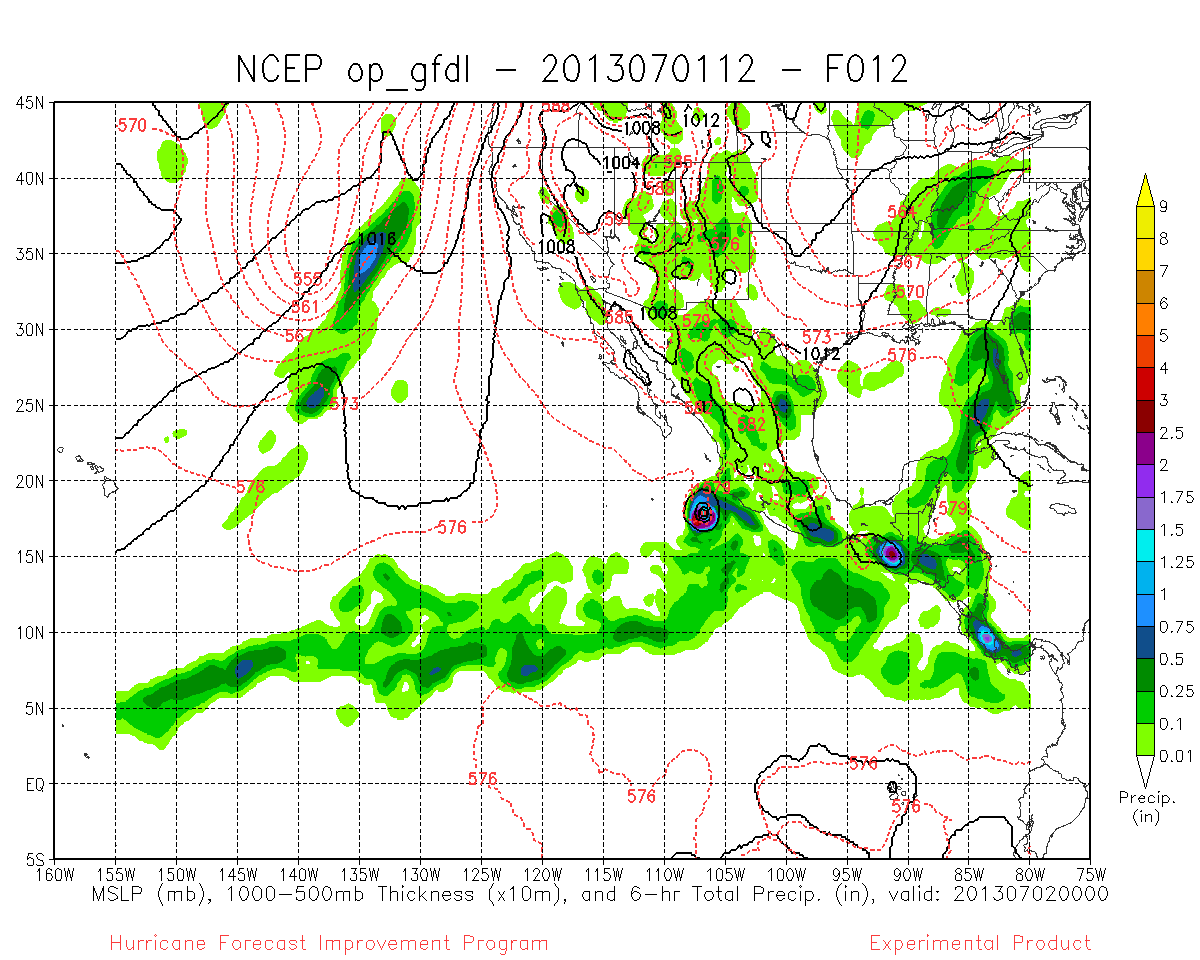
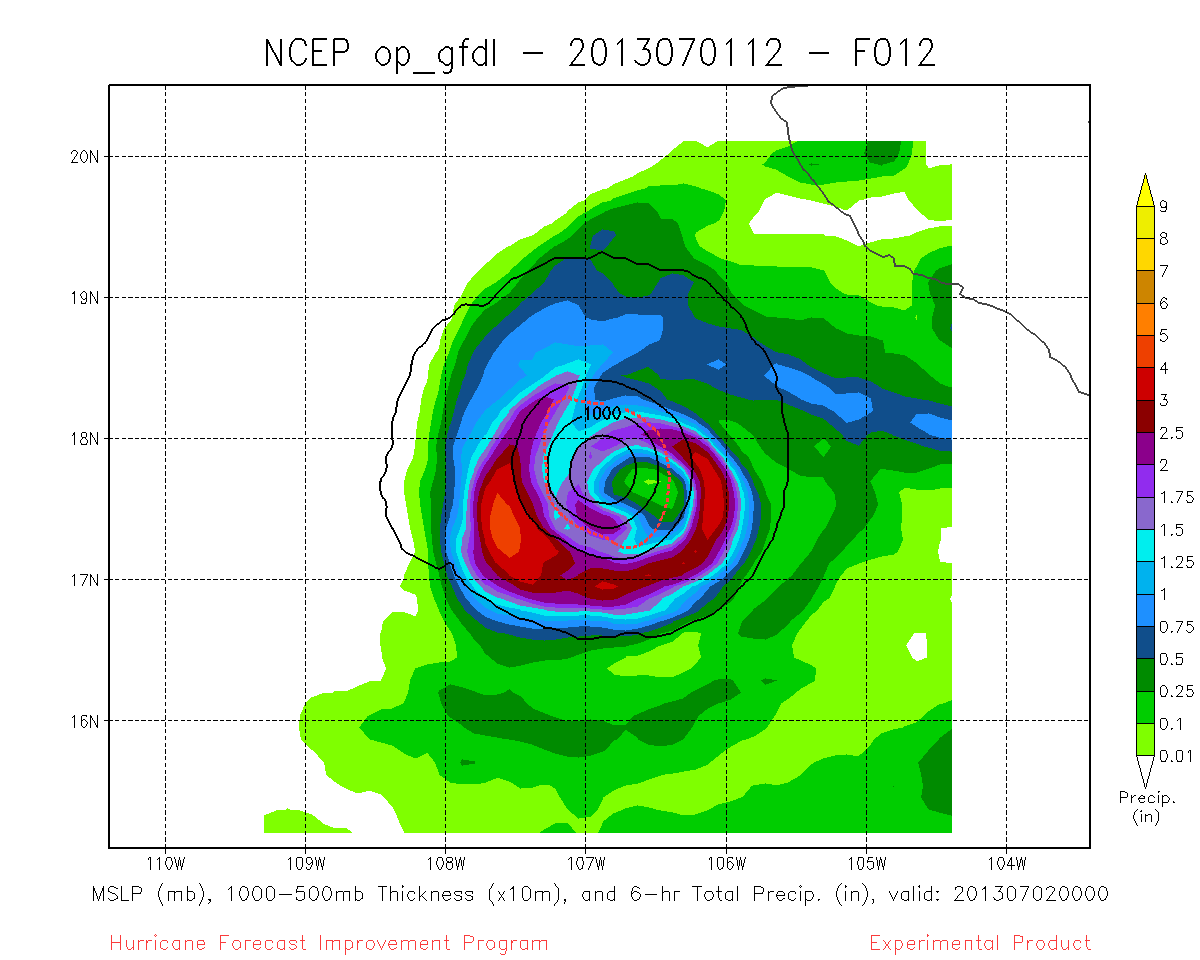
Precip 6-hr Total, Sea Level Pressure (mb), and 1000-850mb Layer Thickness (x10m)
(Sample graphics from TC Dalila 04E, Jul 1, 2013 12Z, Operational GFDL run)
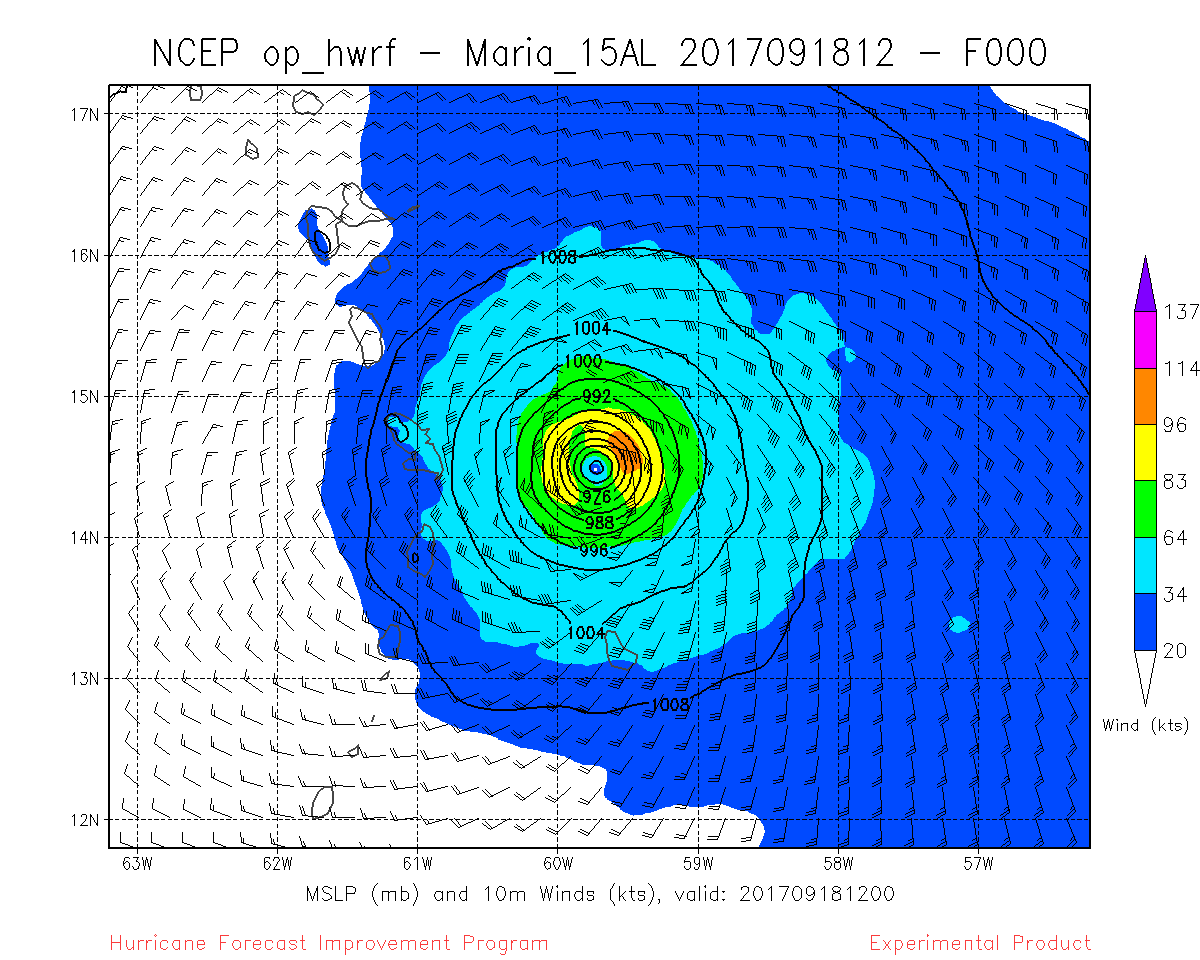
Storm Scale Graphics (Sample graphics from TC Maria_15AL, Sep 18, 2017 0Z, Operational HWRF run)
o
Sea Level Pressure (mb), 10m Wind (kts)
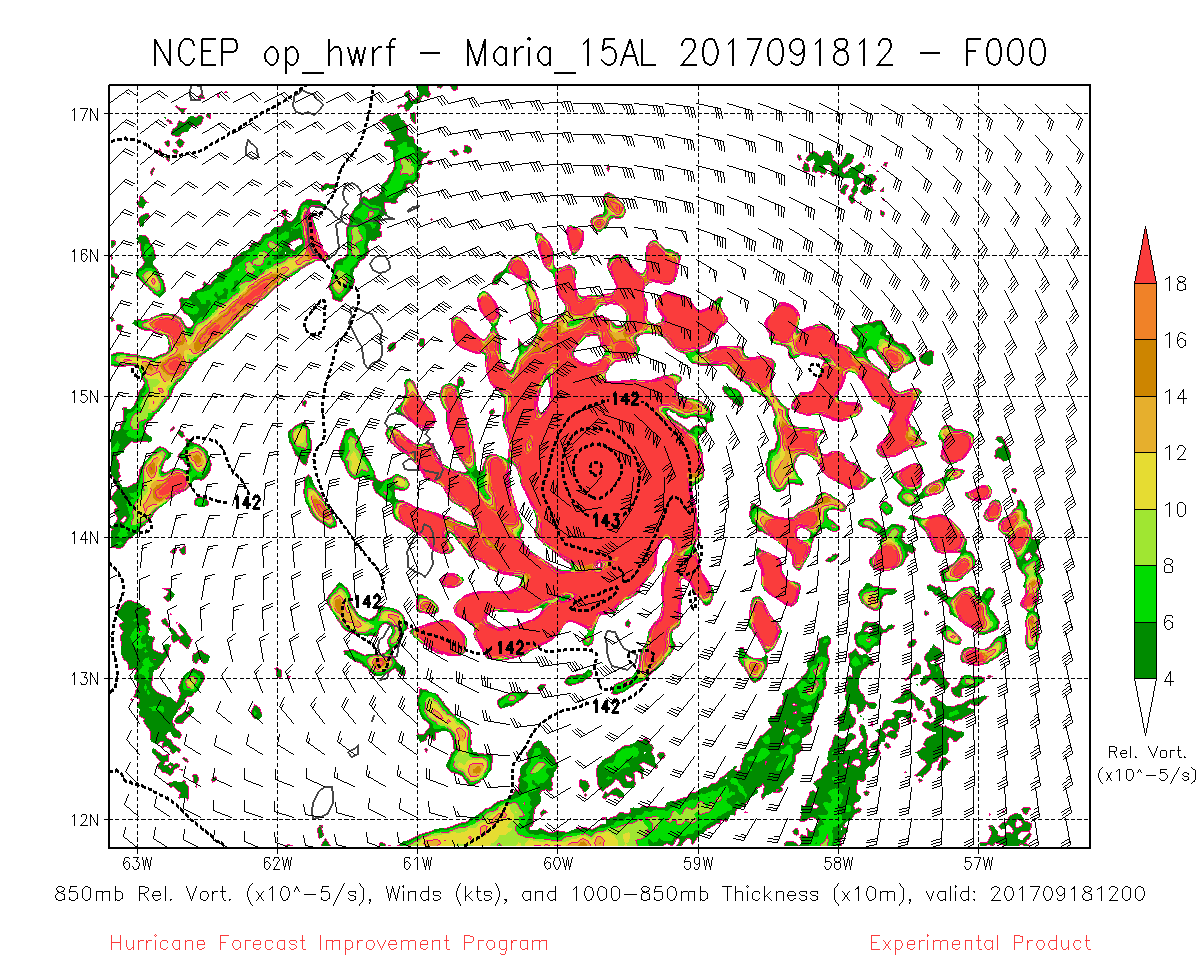
o
850mb Relative Vorticity (x10-5 s-1), 850mb Geopotential Height (x10m), and 1000-850mb Layer Thickness (x10m)
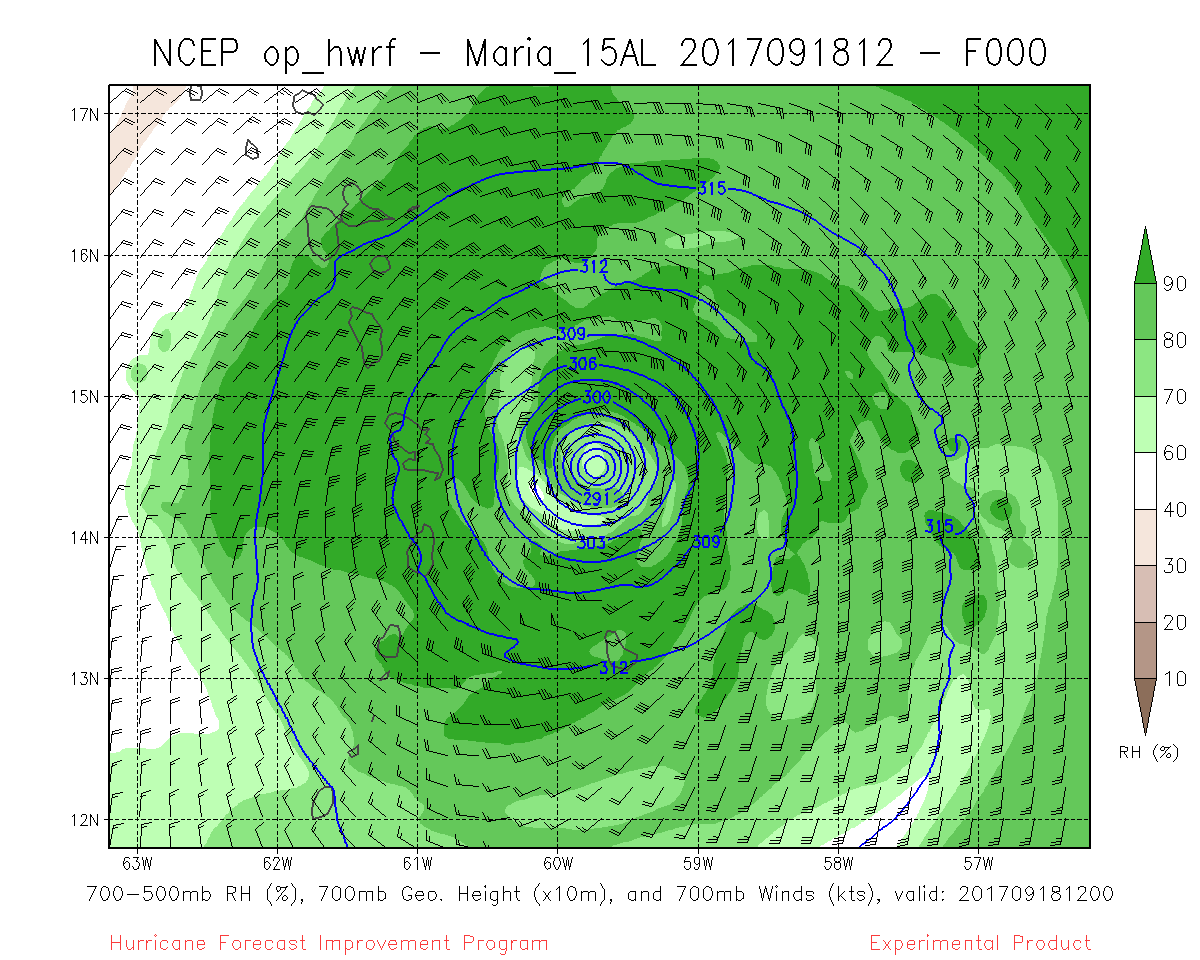
o
700mb Geopotential Height (x10m), 700mb Wind (kts), and 700-500mb layer averaged Relative Humidity (%)
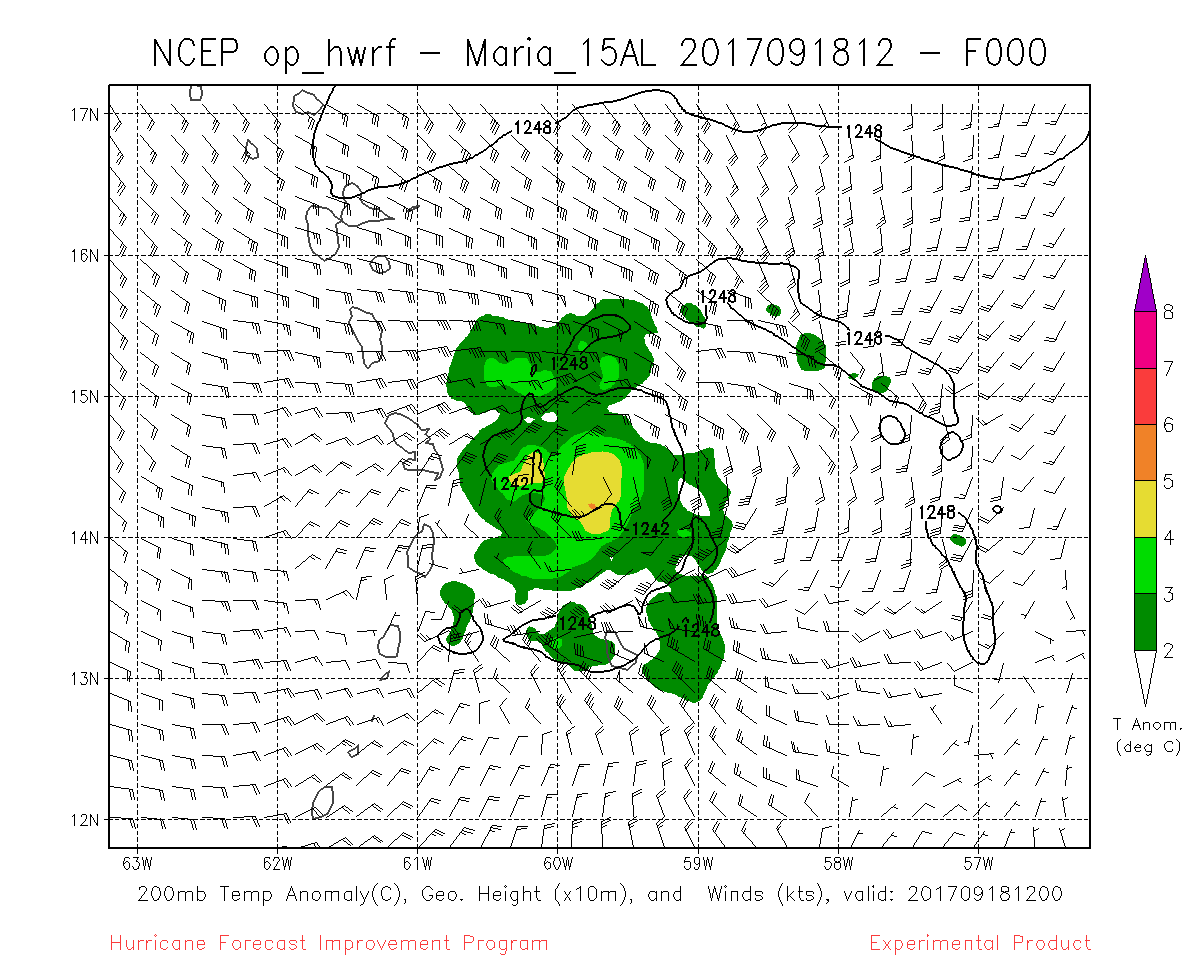
o
200mb Temperature Anomaly (°C), Geopotential Height (x10m), and Wind (kts)
o
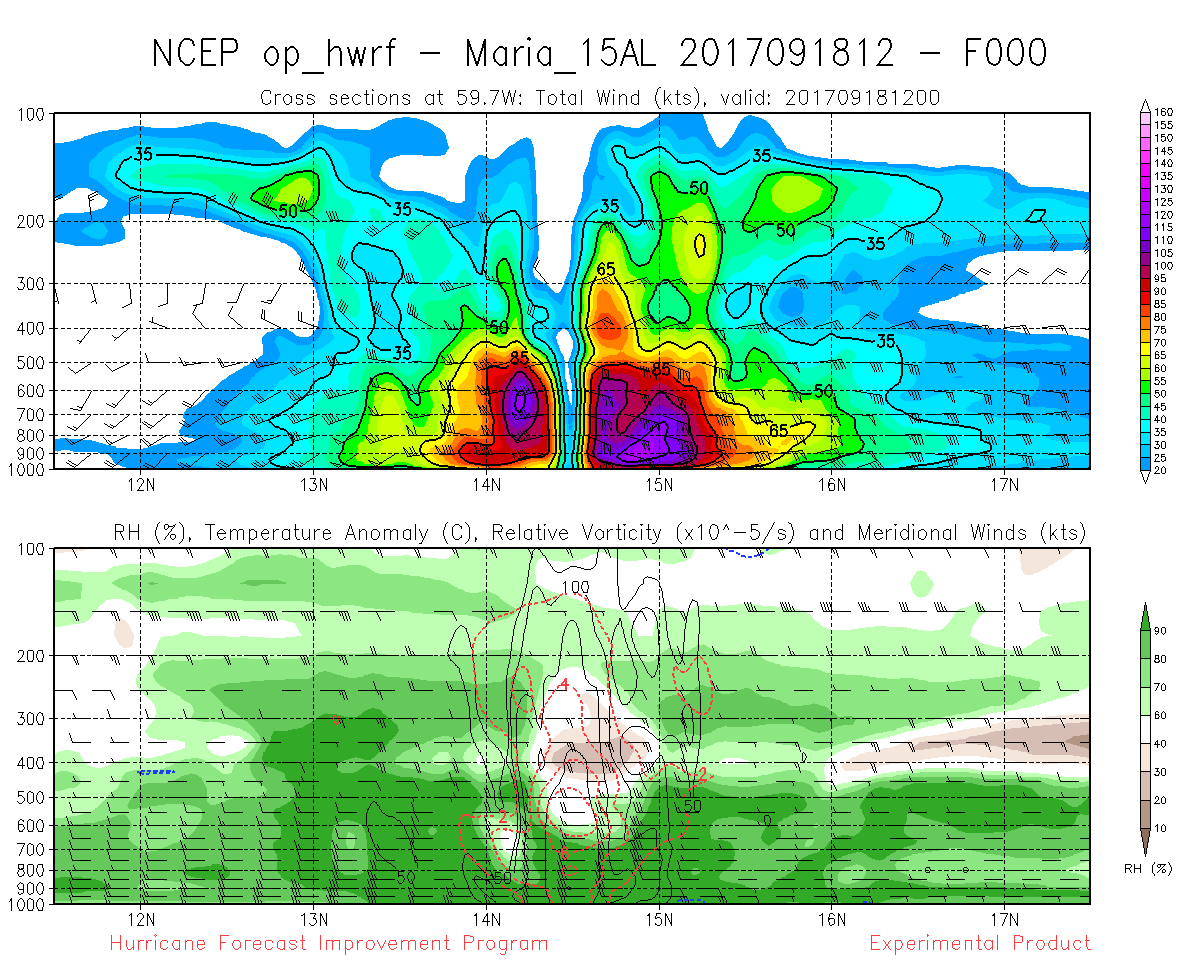
Top: Total Wind (kts); Bottom: Relative Humidity (%), Temperature Anomaly (°C),Relative Vorticity (x10-5 s-1), and Meridional Wind (kts)
o
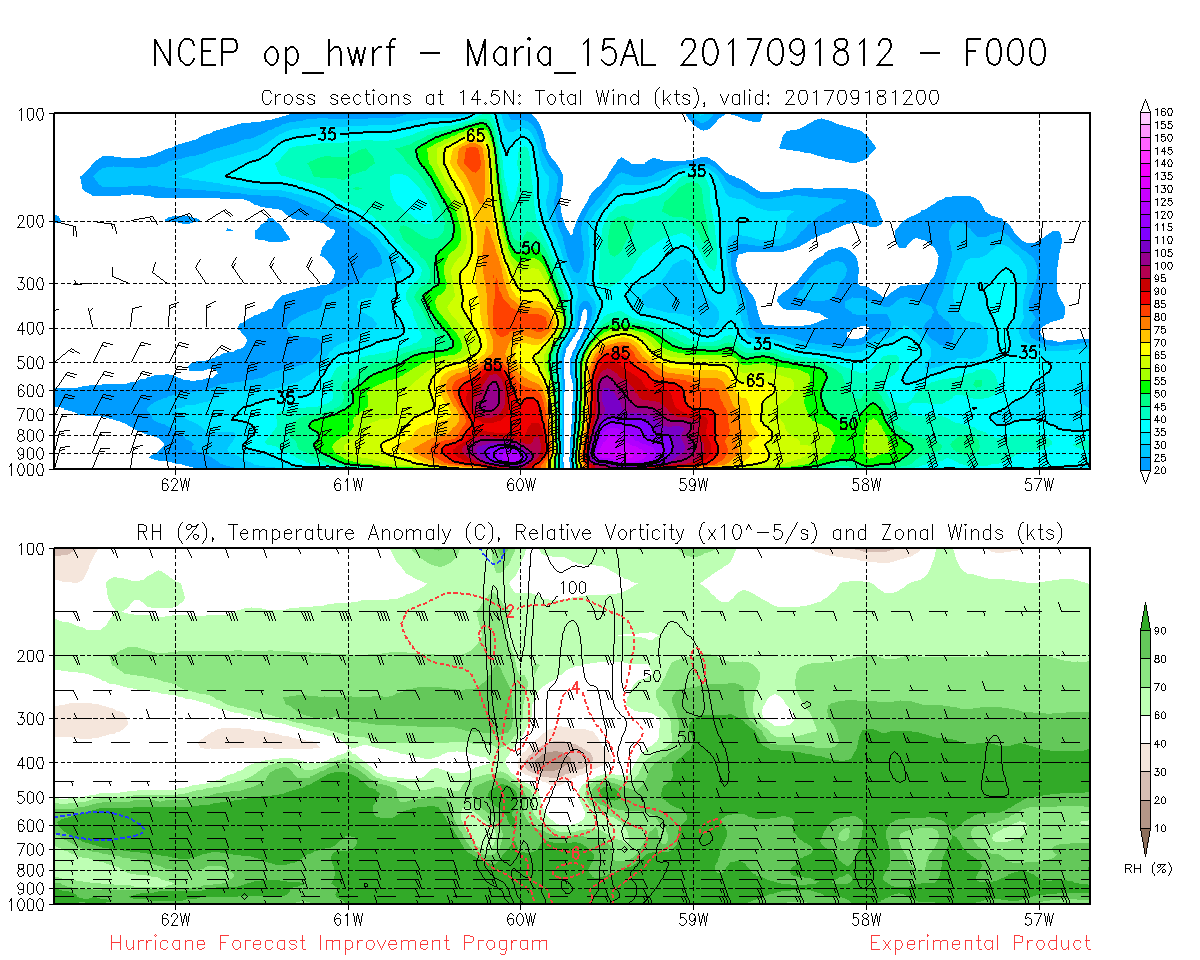
Top: Total Wind (kts); Bottom: Relative Humidity (%), Temperature Anomaly (°C), Relative Vorticity (x10-5 s-1), and Zonal Wind (kts)
o
Precip 6-hr Total, Sea Level Pressure (mb), and 1000-850mb Layer Thickness (x10m)
(Sample graphics from TC Dalila 04E, Jul 1, 2013 12Z, Operational GFDL run)
Participating HFIP Global Models:
Operational GFS
Experimental FIM8
Experimental GFS EnKF
and, HFIP Regional Models:
Operational GFDL
Operational HWRF
Experimental WRF AHW NCAR
Experimental UWisc NMS
Experimental COAMPS-TC
Experimental GFDL Ens Mean
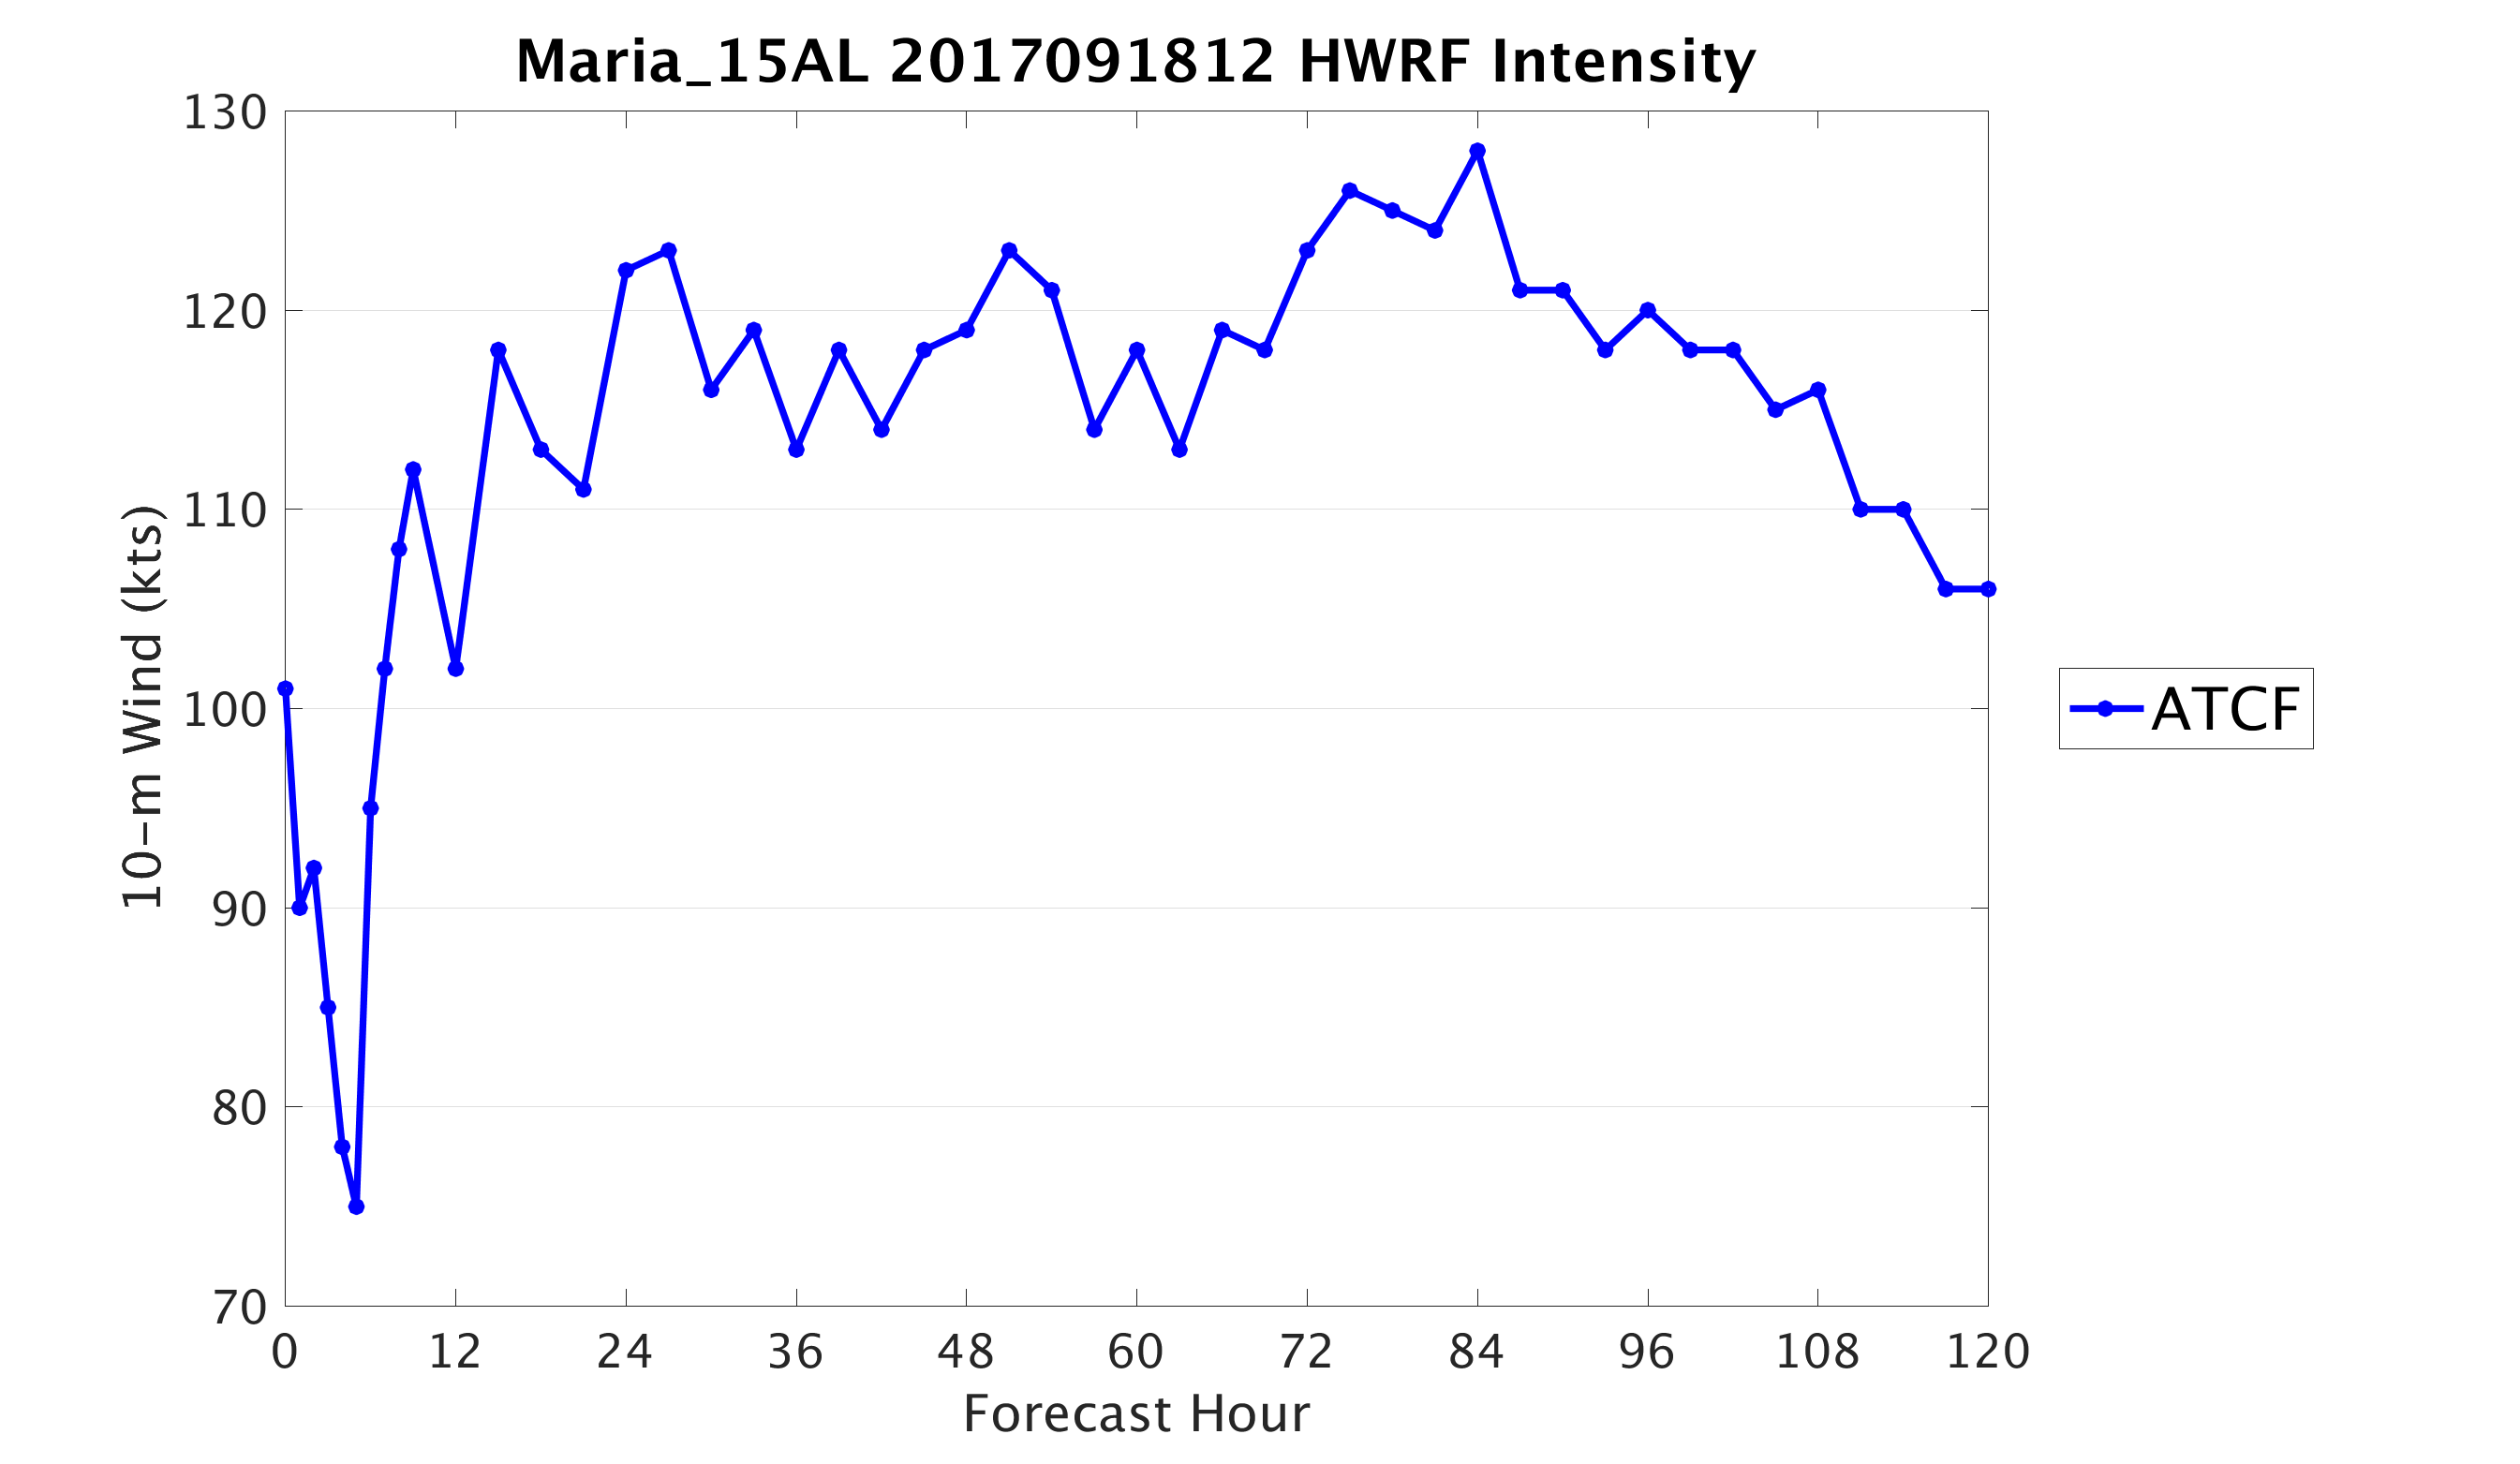
Model Diagnostics Graphics (Sample graphics from TC Maria_15AL, Sep 18, 2017)
There is value in seeing how well the models perform associated with the current model forecast. High-frequency Tropical Cyclone Forecast (HTCF) diagnostics are available for the Operational HWRF, Experimental AHW4 and UWN8 with the plots listed below.
These graphics are created using MATLAB
for numerical computation and visualization.
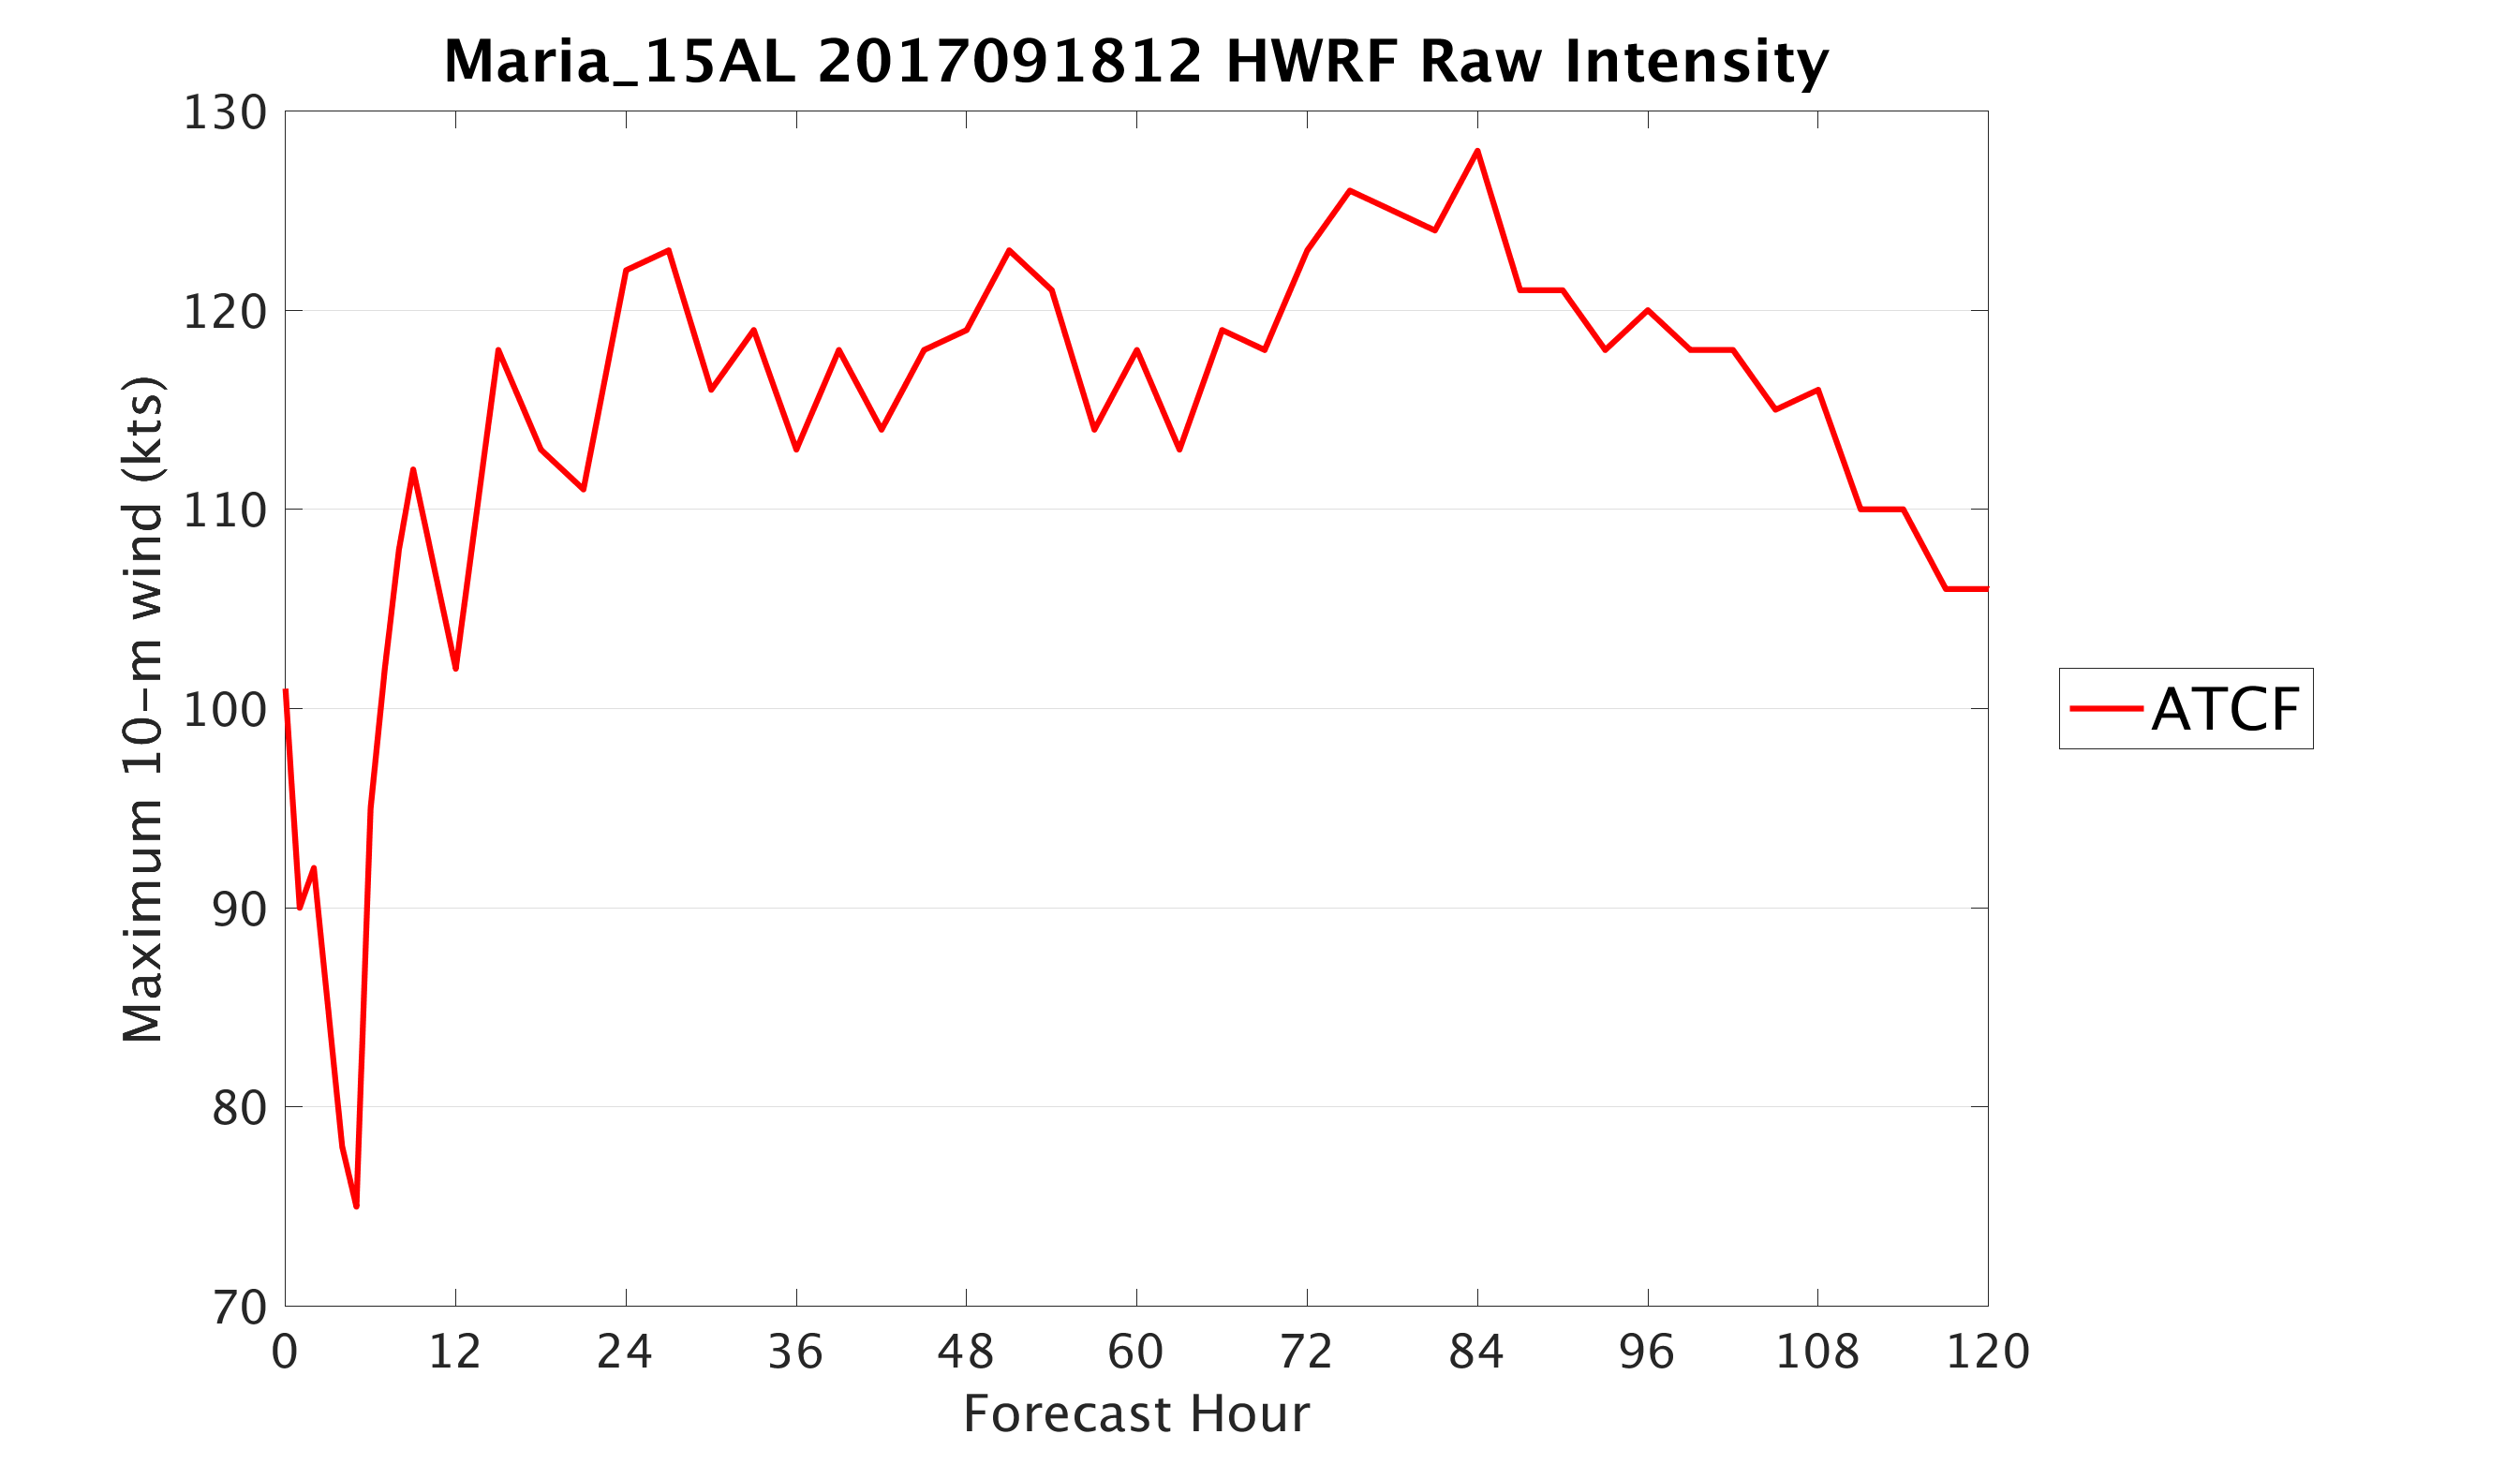
o Raw Intensity
forecast intensity (kts) based on the ATCF and HTCF tracker data
o Max/Min Intensity
forecast intensity (kts): ATCF output and the max/min extremes based on the HTCF tracker
o Track & Intensity
Forecast track and the location of the maximum wind.
o Minimum pressure
(hPa)
o Radius of Maximum Wind
(km), (RMW)
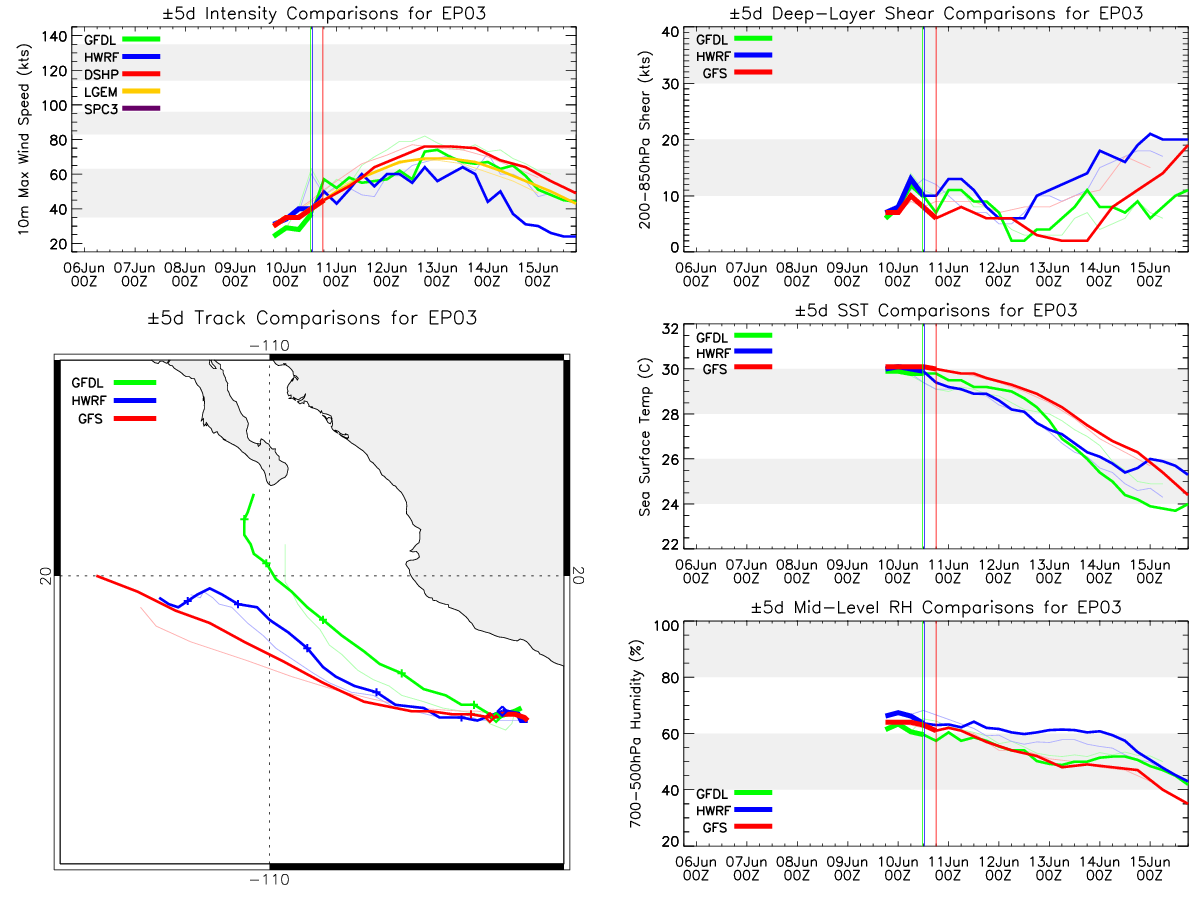
Model Diagnostics Text data files (Sample text from TC Maria_15AL, Sep 18, 2017. Sample image from TC Cristina 03E, Jun 09, 2014)
Text diagnostic files are available for the Operational GFDL and HWRF models and for some the Experimental models including AHW4.
o
Storm & Sounding Diagnostic
and
image
To Products Guide (above)
To Deterministic NWP model products, see http://www.hfip.org/data/?Path=nwp
2) HFIP Probability products:
CIRA, Andrea Schumacher
Operational NHC wind speed probability model with global model ensemble tracks. Plots are not based on one model, several ensemble models go into the solution: 133 tracks used: GFS (20), CMC (20), EMCWF (50), FNMOC (20), and UKMET (23).
o Hybrid dynamical-statistical Windspeed probabilities cumulative comparisons, 2020 06 02 00
Past participating:
GFDL, Tim Marchok
See ...
NCEP/EMC GFS Para Cyclogenesis Tracking
Hint: Select items from the 2nd column, after selecting the date
Past participating Ensemble Models:
NCEP (US National Center for Env Prediction) GFS Ensemble
CMC (Canadaian Meteo Centre) Ensemble
FNMOC (Fleet Numerical Meteo & Ocean Center) Ensemble
ECMWF (European Centre) Ensemble
To Products Guide (above)
To Probability products, see http://www.hfip.org/data/?Path=prob
